If you’ve ever been curious exactly how Google works, you might have found it a bit difficult to get your head around – which is completely understandable, as it’s not exactly simple being the most powerful search engine in the world!
However, the generous guys at the Big G have taken time out of their hectic schedule to let us know exactly how they do it – in simple terms, of course.
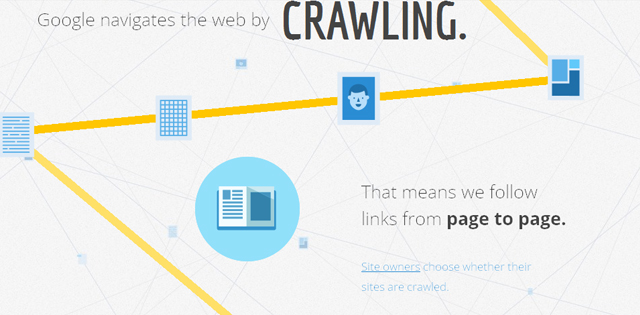
Rather than producing a lengthy PDF or webpage for you to trawl through, they have decided to present this information in the style of the latest tool in inbound marketing: an infographic.
If you aren’t familiar with the term, don’t panic – it really is as simple as it sounds: a graphic that contains info.
An infographic is basically an image that informs the audience of something – usually a collection of facts related to your business. The beauty of this technique is that people love to read new and interesting facts and information, especially if the subject matter is interesting, shocking or humorous – if your infographic is good, there’s a high chance of it being shared via various websites, blogs and social media networks – and if you embed a link to your website in this graphic, the possibilities for inbound traffic are enormous, especially if your graphic goes viral!
Of course, the guys at Google don’t like to stick to the rulebook, and this infographic stands head and shoulders above the rest, in terms of both content and delivery.
One of the most interesting aspects of Google’s take on the infographic strategy is that unlike a normal infographic which tends to be a flattened image file, the Big G’s infographic is made using HTML and CSS in a similar fashion to how a website would be constructed. This offers several advantages over the standard infographic format:
- it is dynamic – this introduces a degree of interactivity by allowing the content to be animated, and it makes use of this splendidly – the graphic is made much more immersive through the use of simple animation as you scroll down, alongside hover popups that impart even more useful information and other HTML5/CSS3 trickery (including the nifty counter at the very bottom that shows you how many searches have been conducted since you started reading the infographic).
- It can be indexed by search engines – the fact that all of the included text is still text and not flattened in an image file makes it a lot easier for Google’s own search bots (and the search bots of other search engines) to index the content. To Google, this isn’t an especially important concern – as they are pretty much the be all and end all of search anyway, but it is definitely worth considering if you are interested in creating your own infographic strategy.
- It is more accessible – The fact the content is available to screen readers and other accessibility tools makes the content included available for everyone.
Of course, there is a caveat to this technique – the fact the infographic is not a simple image file makes the sharing of the graphic more difficult – and this is one of the key strengths of infographics as a marketing strategy. This probably doesn’t pose a problem as far as Google’s intentions for this infographic are concerned though – Google is one of the few businesses around that doesn’t really need to pay that much attention to their inbound link portfolio.
If you think an infographic could be a good move for your business, and you’re interested in learning how you could adapt the strategy to your own needs, please don’t hesitate to get in touch with us and our team of designers can produce a stellar infographic for you that is sure to be shared all over the web!
